BLOG
24 Mobile App Stats 2023 to Grow Your User Engagement
You may also like:
- How to Improve Your Mobile App User Experience
- Turn Downloads into Dollars: Smart Ways for App Monetization
- How Super Apps Shaping the Future of Mobile Apps
This is a list of 24 app usage statistics for 2023
Here we will cover:
- App Usage statistics
- App Revenue
- App Monetization
- Google Play Store Stats
- Apple Store stats
- Rising app categories
- Social trends
- Audience and consumer habits
- User Acquisition

How big is the mobile app market in 2023?
Do you know that the global app market was valued at USD $475.90 billion in 2022 and it is expected to grow at a compound annual growth rate (CAGR) of 13.8% from 2023 to 2030?
It is expected to reach US$775.50bn by 2027.
Applications like gaming, health and fitness, Social Networking, Music and Entertainment, Retail and e-commerce are going to going to have a greater impact on the mobile app market.
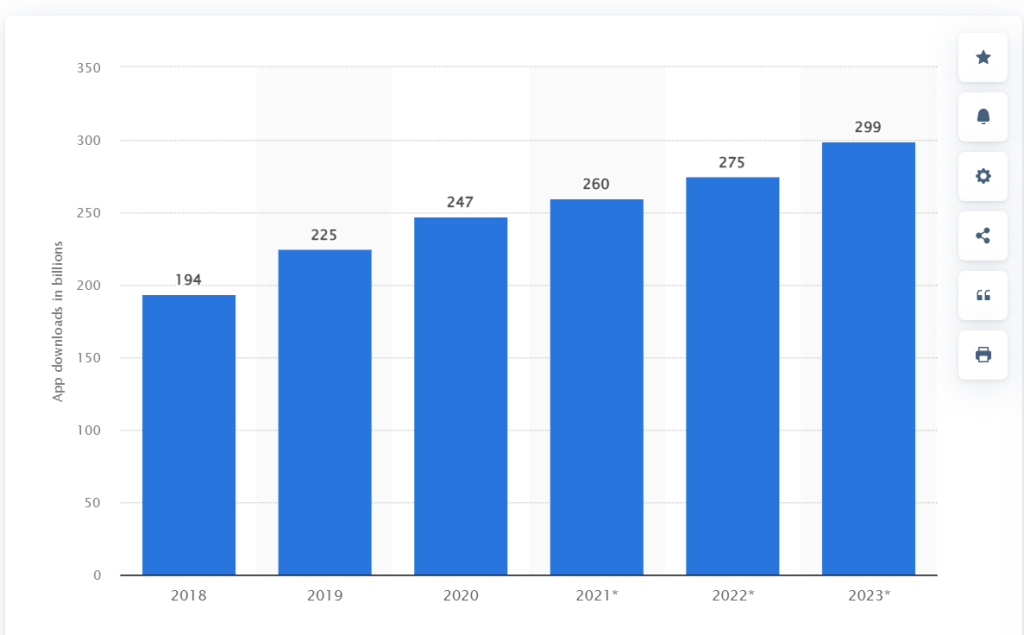
Number of Mobile App Downloads Worldwide from 2018 to 2023 (in billions)
We are witnessing a steady growth in app downloads each year and this trend will continue in the coming years.
In 2022 there were more than 218 billion app downloads, a 7% increase from the previous year.
Source: Statista
Mobile App Downloads
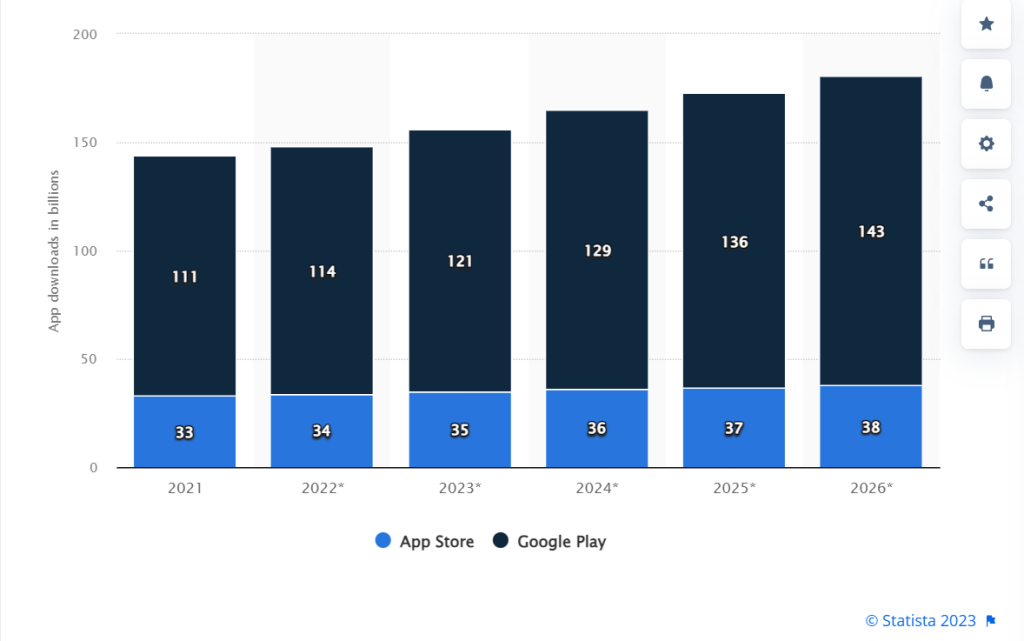
The latest mobile app stats state that around 225 billion apps were downloaded in 2022 and the number is expected to grow. Statista projects that by 2026 consumers will download 143 billion mobile apps from the Google Play Store and 38 billion from the Apple App Store.
The projection indicates an increase in app downloads of 30% and 15% in Google Play Store and Apple App Store respectively compared to 2021.
Apps currently Available on App Stores
According to reports in 2022 approximately 1.6 million apps were present in the Apple App Store and over 3 million apps were available in the Google Play Store.
Above 3000 apps are added daily in the Google Play Store, though it might seem less but when added up the number will reach a humongous level in a few years.
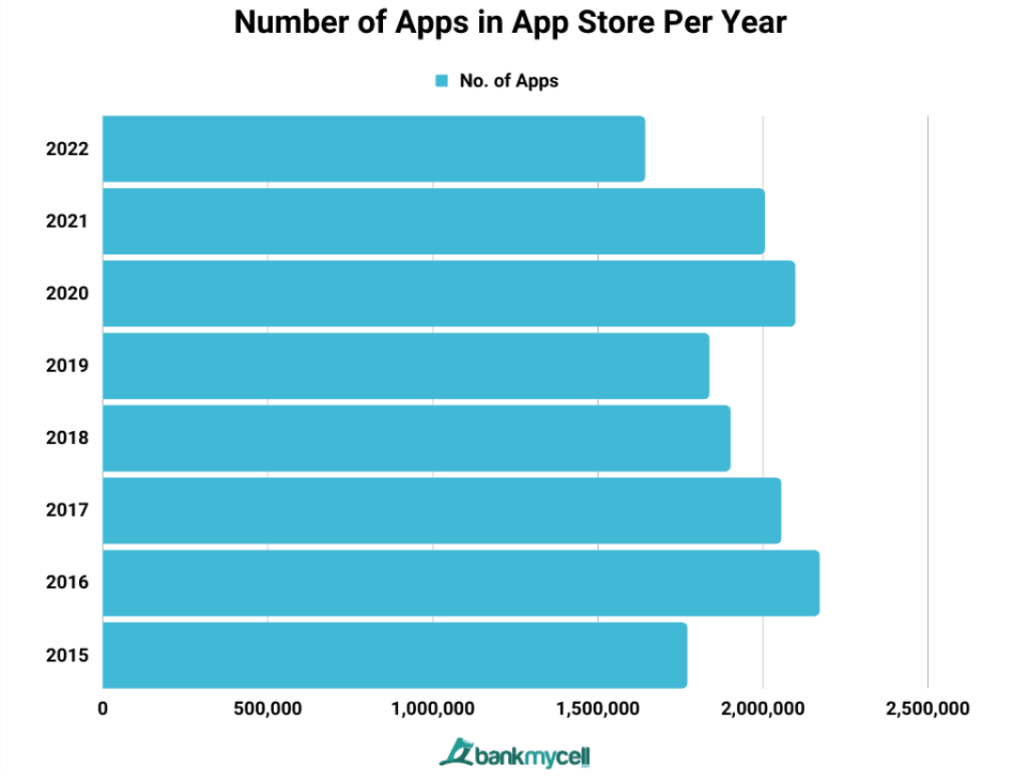
Source: bankmycell
Daily Engagement and Addiction
Do you know that people spend around 5 hours on average daily using mobile applications? Report suggests that people check their phones 144 times daily and 75% of people check their phones within five minutes of receiving notifications.
It has gone to the extent that 57% of Americans consider themselves to be addicted to their mobile phones.
Source: Reviews.org
Importance of apps for users/app Demographics
Reports suggest that almost 72.6% of users globally will access the internet only from their smartphones by 2025 which equals 3.7 billion people. 76% of smartphone users have mentioned that without apps their smartphones are useless. Source: CNBC
App download and usage by country
In 2022 we have seen approximately 111 billion apps were downloaded in China. India had 29 billion the same year, and the United States saw 12.24 billion downloads. The number is expected to rise in most countries.
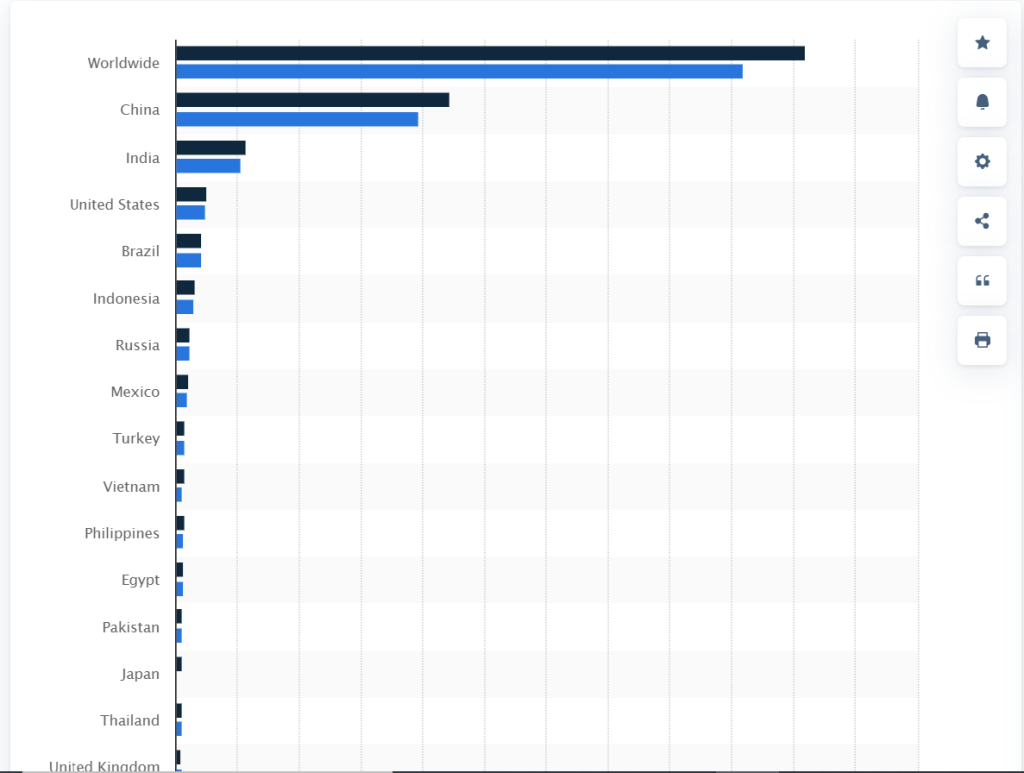
Source: Statista
Gender Distribution
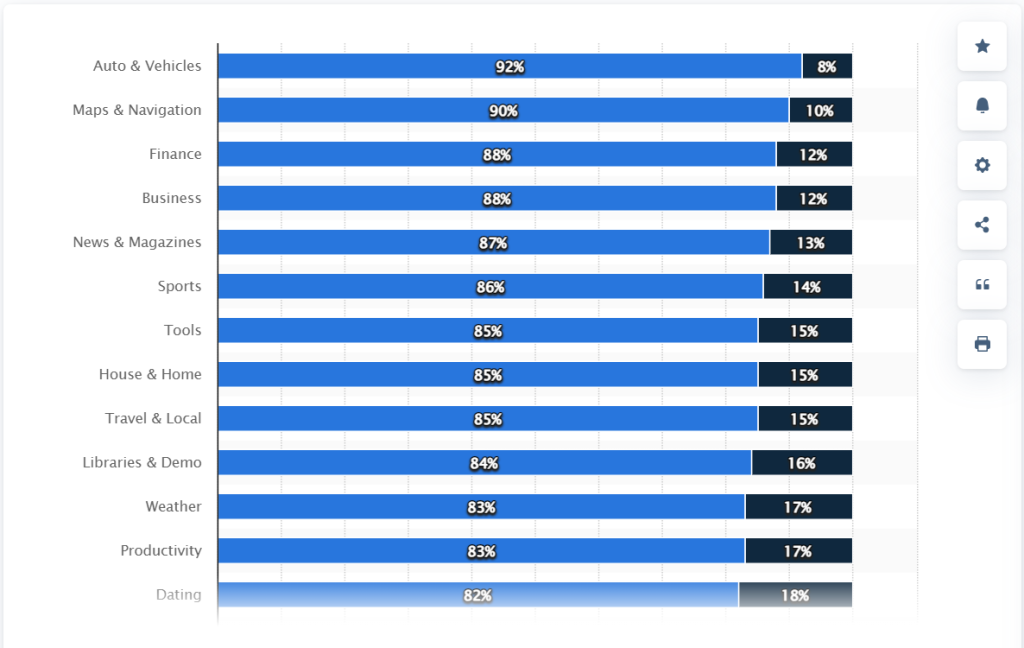
Mobile app stats reports in 2022 suggest that only men use 92% of auto and vehicle apps and only 8% of women use them. Finance and business apps were used by 88% of men and 48% of women used parenting apps.
Source: Statista
App preferences by age
18-24-year-olds spend 112.6 hours, 25-34-year-olds spend 102.4 hours, and 35 and above spend less than 100 hours on apps monthly. Mobile app stats also show people above 65 years of age spend less than 51.4 hours per month on mobile applications.
Source: BusinessofApps
Mobile vs. Desktop usage
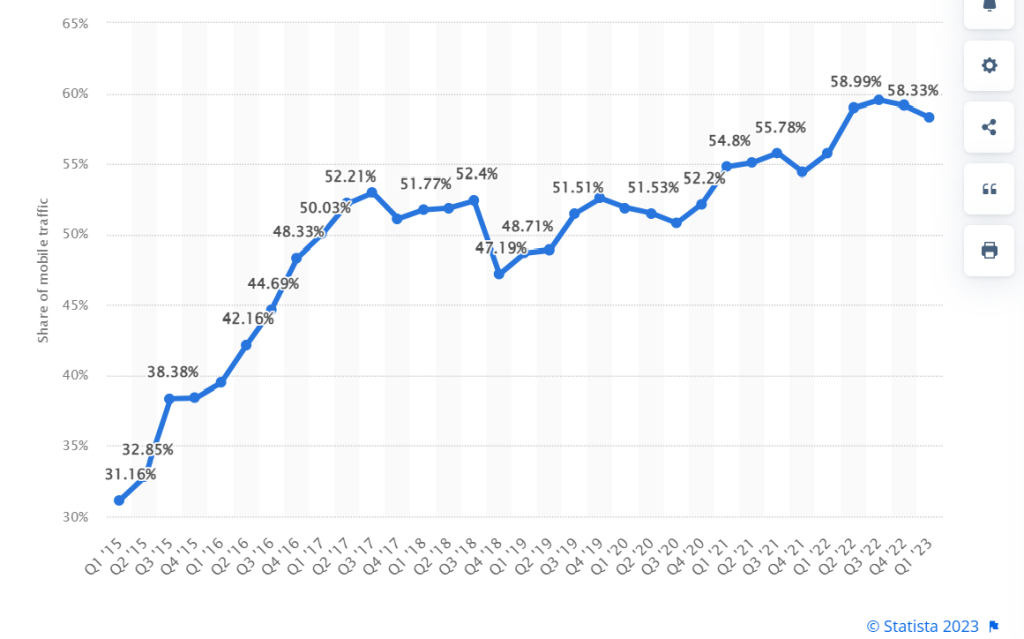
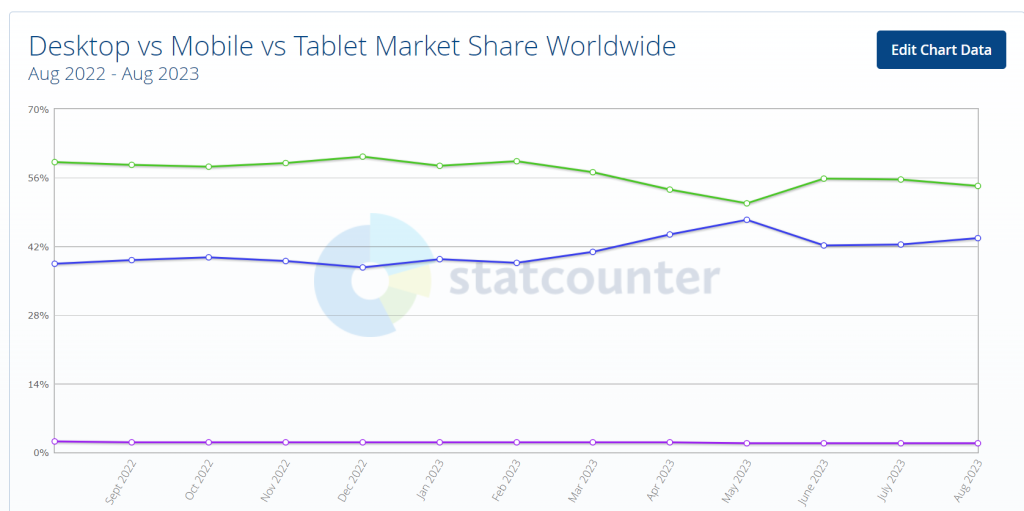
Global mobile traffic is currently at 55%, desktop computers at 43%, and tablets at only 2%.
Source: Statcounter
App revenue
In 2022 people have spent around US$167bn on mobile apps. Source: Statista. It is predicted that it will generate US$935bn in revenue by the end of 2023. Source: Serpwatch.
Usage Behaviour Pattern
Mobile app stats show that after 3 years almost 60-70% of users’ mobile app usage pattern changes. This can be the result of demographics like age, social and financial status, location, lifestyle, and more.
Source: Springer
App Download forecast
It is projected that in 2026 users will download 143 billion apps from the Google Play Store and 38 billion downloads from the Apple App Store.
Source: Statista
Mobile App Economy Forecast
The app revenue growth is projected to rise by 8.58 (CAGR 2022-2027). This will result in an increase in the market value of US 755.50 billion by 2027.
Source: Statista
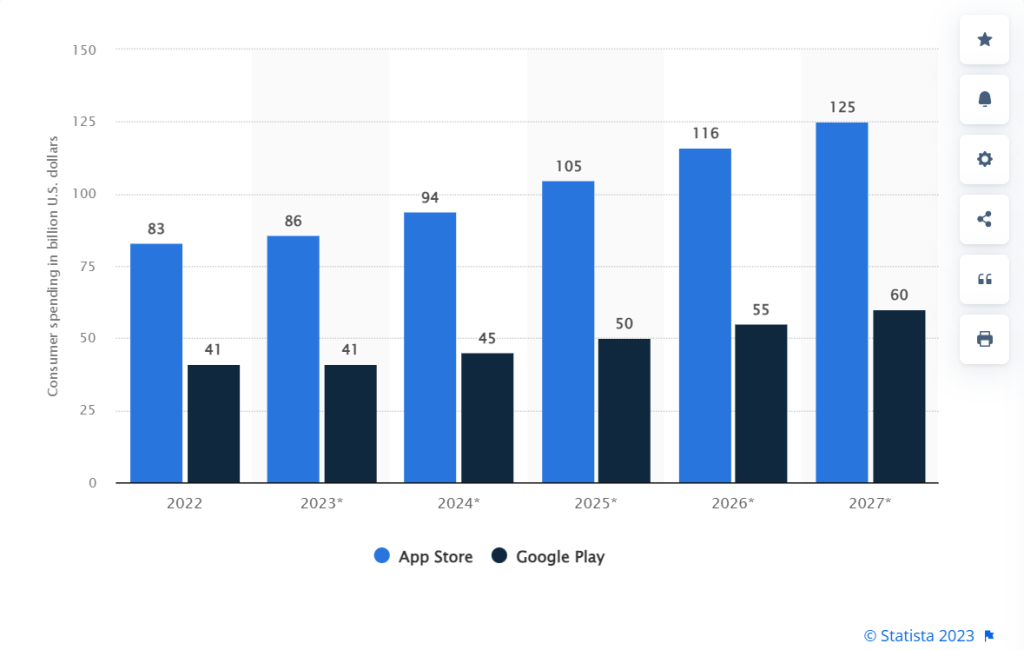
App Store Spending Forecast
It is projected that by 2027 people will spend US 125 billion on Apple App Store and a combined spending both in Google Play Store and Apple App Store will reach about US 186 billion.
App Usage:
The average smartphone user spends about 4.2 hours per day using mobile apps.
Social media apps and messaging apps are among the most frequently used mobile apps.
Gaming apps account for a significant portion of app usage, with users spending an average of 48 minutes per day playing mobile games.
Categories and Popularity:
Games are consistently the most popular app category, generating a significant portion of app revenue.
Social networking apps, messaging apps, and entertainment apps are also highly popular among users.
Business and productivity apps have seen increased usage, especially with the rise of remote work.
Monetization:
In-app advertising is a major revenue source for mobile apps, accounting for billions in annual revenue.
Subscription models are becoming more common, with apps like Netflix and Spotify relying on this model.
Freemium apps, which offer both free and premium versions, are prevalent in app stores.
Global Reach:
Facebook is one of the most downloaded apps globally, with billions of downloads.
WhatsApp, owned by Facebook, is the leading messaging app worldwide.
TikTok gained rapid popularity globally, with billions of downloads in a short period.
App Store Competition:
Google Play Store had more app downloads, but the Apple App Store generated higher revenue due to user spending habits.
The Apple App Store is known for its strict review process, which contributes to higher app quality.
Google Play Store offers more free apps and is more accessible to developers.
Mobile App Development:
Over 71% of app developers develop apps for Android, while around 56% develop apps for iOS.
Swift and Kotlin are the preferred programming languages for iOS and Android app development, respectively.
App Security:
Mobile app security is a growing concern, with an increasing number of data breaches and cyberattacks targeting apps.
Biometric authentication methods, such as fingerprint and facial recognition, are commonly used for app security.
User Acquisition and Retention:
User acquisition and retention are critical for app success, with high competition in app stores.
Push notifications and personalized content play a vital role in user engagement and retention.
Emerging Trends:
Augmented reality (AR) and virtual reality (VR) apps are gaining popularity, with applications in gaming, education, and healthcare.
Progressive web apps (PWAs) are being adopted as a hybrid approach to web and app experiences.
Artificial intelligence (AI) and machine learning are integrated into many mobile apps for personalized experiences.
Related Topics
Trending Topics
Want to build Super app for your business?

